Graphbased Wavefunction Collapse
📅 7. 8. 2024
This project is available on GitHub:
Resources
This project is based on a paper Automatic Generation of Game Content using a Graph-based Wave Function Collapse Algorithm from CoG (Conference of Games), which first introduced me to the idea that WFC does not have to be limited for use with 2D (or 3D) grids - it can be implemented for general graphs too.
Although my work can be used with general graphs, if you plan to work with 2D and 3D grids only, I would recommend the great WFC algorithm by mxgmn. While my project doesn’t draw from mxgmn’s work I consider it an outstanding resource.
If you are new to WFC check out this article by Robert Heaton: The Wavefunction Collapse Algorithm explained very clearly.
Motivation
Now, you may be wondering - if there already exists a great implementation of WFC in many (and I mean in many) languages why do we need another one? If you read through Robert’s article you might have an idea.
Features of a typical WFC implementation
- square grids
- symmetric rules
The rules are specified as A-B, that is, A and B can be adjacent.
Not everything is a grid
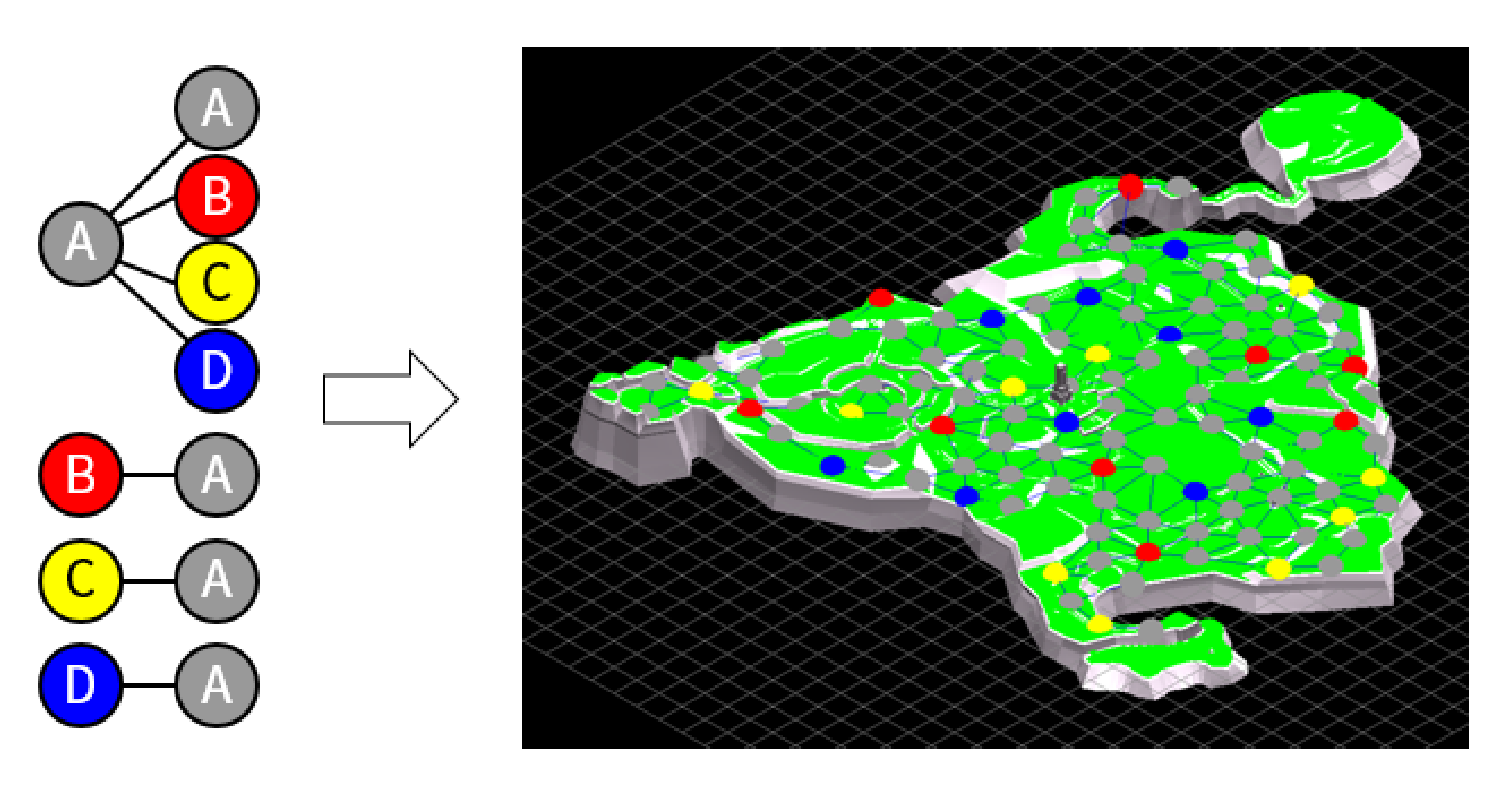
In two years of studying CS in college, I found out that not all problems can be reduced to a square grid. For example the randomly generated map for the game Frostrain:
Symmetry of rules problem
In the game Peglin, after each battle, the player has a choice between two other options. And since the player cannot backtrack, the map is a DAG - oriented graph.
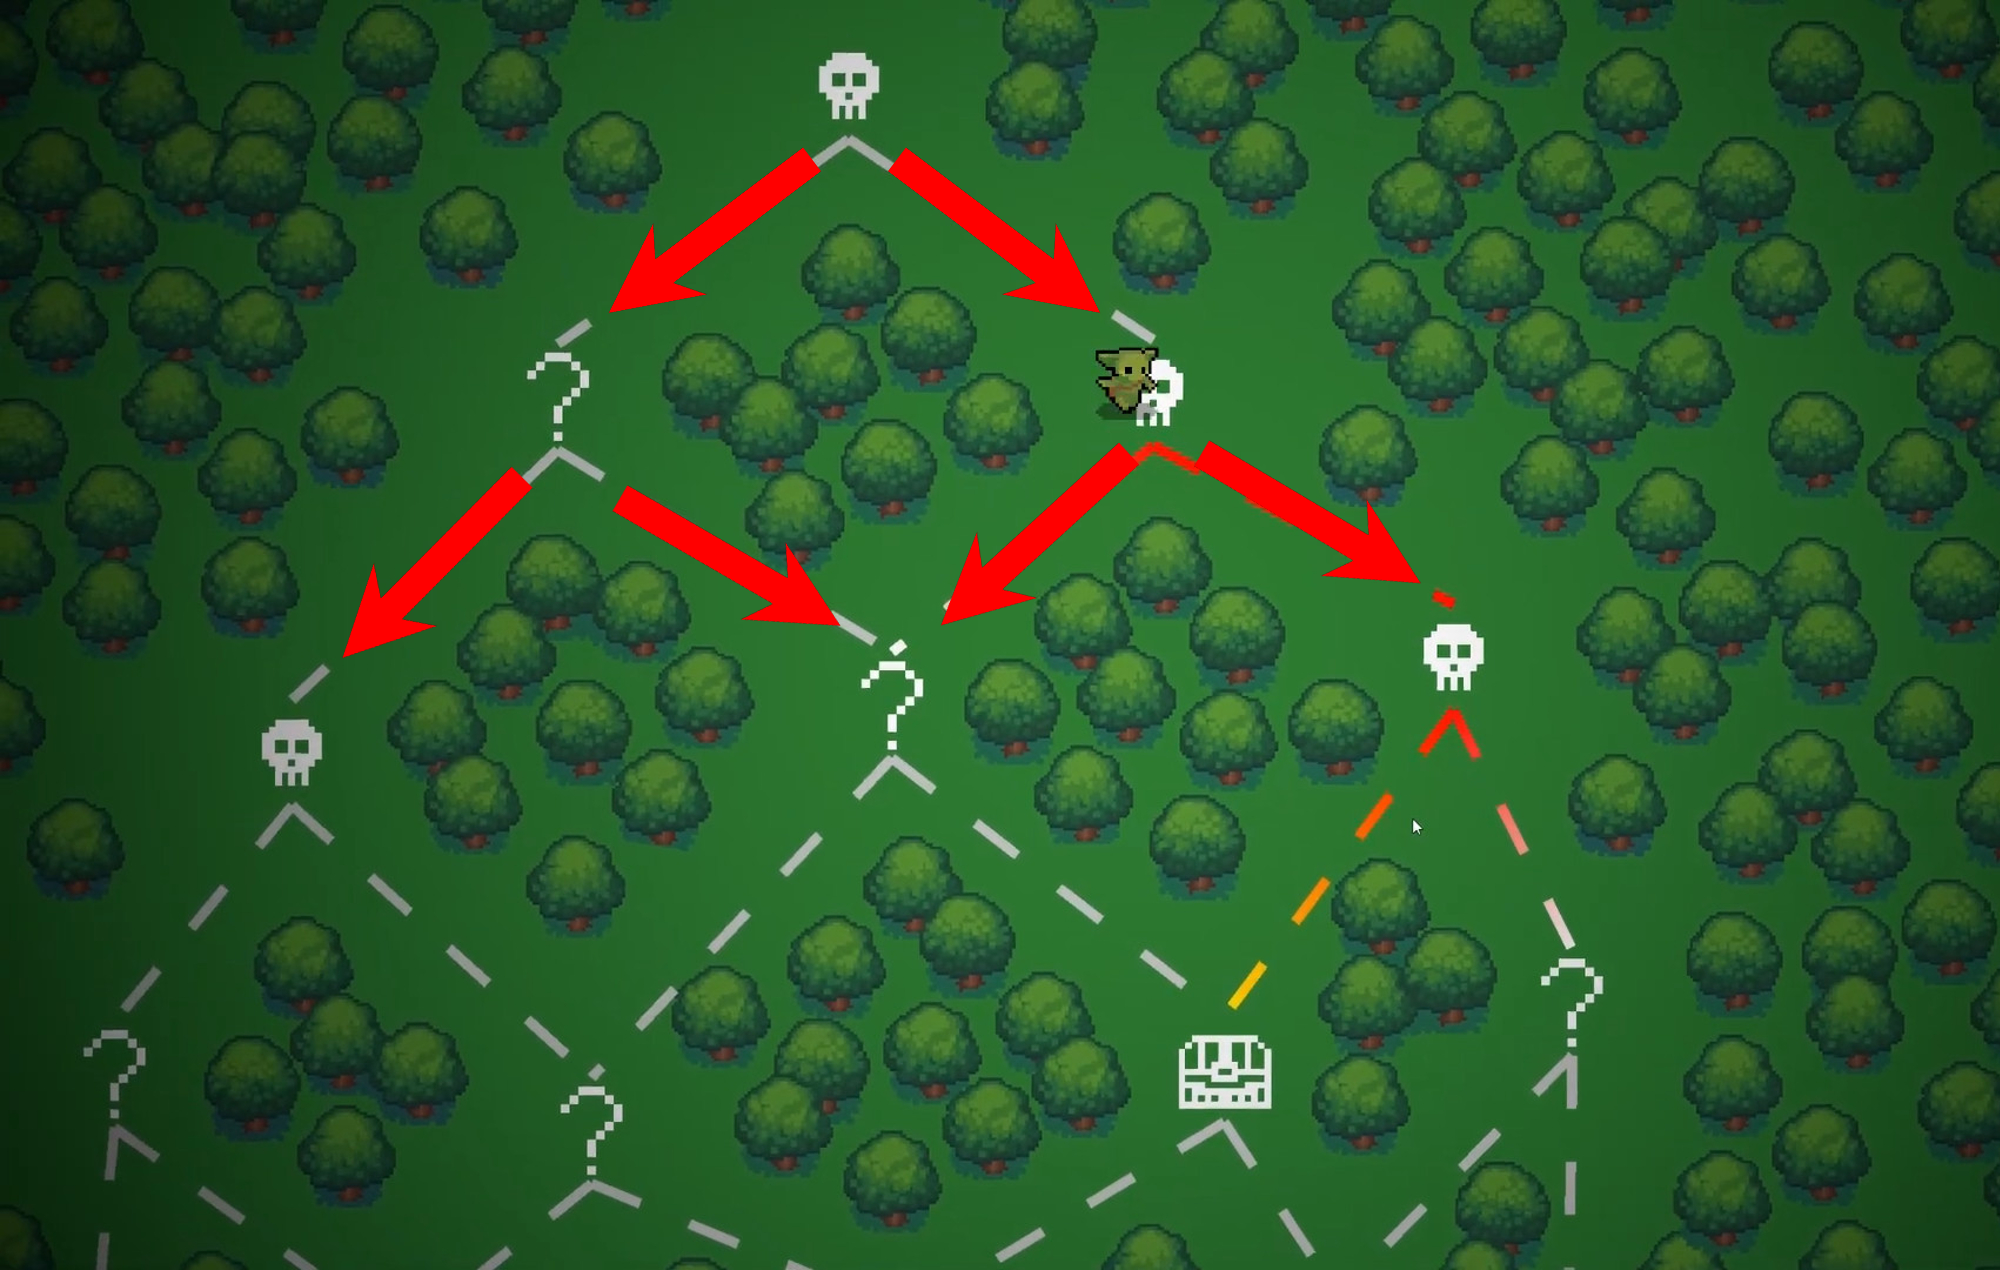
Suppose we want the player to have the option to restock (💰) after each boss (💀). But we certainly don’t want the player to restock before the boss - the rule is not symmetric. We express it as 💀 -> 💰, typical WFC doesn’t account for this, we don’t have the option to specify non-symmetric rules. (Some implementations of WFC retrieve rules out from the example image, such rules are inherently symmetric.)
More complex game level constructions might look like this:
Adjacency problem
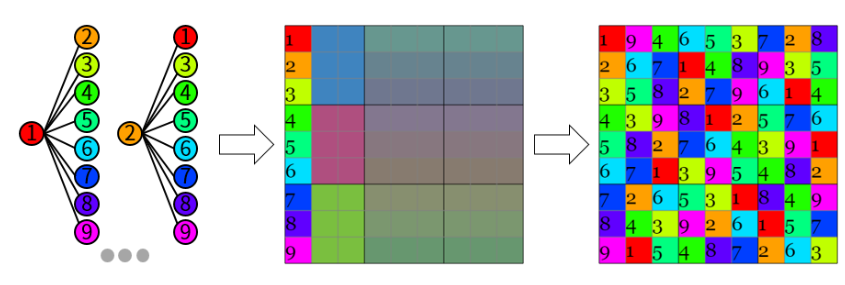
Of course, graphs can be significantly more complex. Sometimes you need to express dependencies between cells that are not neighbors in the square grid. GBWFC can be used to solve Sudoku, where although the rules are symmetric, not all dependent cells are adjacent to each other.
A cell has only four neighbors in the grid, but according to the sudoku rules it depends on a column, a row and a 3x3 square. We could barely contain that in a square grid.
Another example would be coloring a map, cool, the world map is a planar graph after all, so it’s easy and we can even do it with just four colors! The opposite is true, what about such exclaves and enclaves? For example, Kaliningrad and mainland Russia should have the same color on the map, even though they are two cells separated by different cells. If more such problems come together, we may not be able to keep track of them.

From these considerations, we can clearly see that the best would be to have an algorithm that works on an general oriented graph - any other problem can be converted to it.
Why not use the conventional graph coloring algorithm?
One of the advantages of WFC is that we can specify in advance how often each cell type (color) should appear. For example, rooms with bosses shouldn’t be frequent, you can’t tell that just from the rules, so we pass probabilities/numbers to WCF at the beginning (e.g. normal : 80, boss : 15, treasure : 5). The standard implementation of coloring doesn’t do that.
Inner workings
Too see this library in action checkout provided examples in the GitHub repository.
Graph
The library contains it own classes to represent a Graph and its Nodes. A Graph is a list of Nodes that can point one to another. Method to convert graphs from QuikGraph to library’s Graph is provided.
Methods to save graphs to the DOT format and render them using the GraphViz library are implemented and are used for visualization throughout this project.
Rules
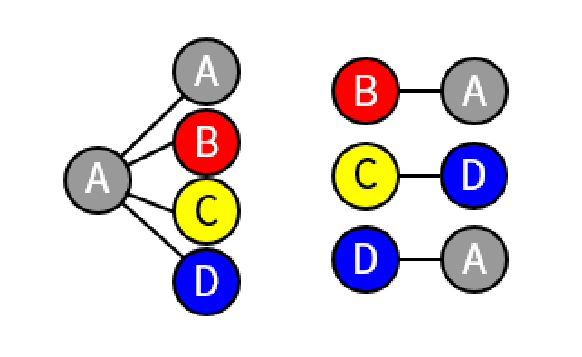
Rules are relationships between a parent node and its children. For example we can define a rule (0, [ 1, 2, 3 ]) - if a node has assigned color 0 then its children are allowed to be colored 1, 2 or 3.
Rules can be loaded from a JSON by calling RulebookParser.RulesFromJSON method. Format example:
{
    "0": [ "0", "1", "2", "3" ],
    "1": [ "0" ],
    "2": [ "3" ],
    "3": [ "0" ]
}
Graphical representation of rules above:
Solver
Recursively tries to meet all the rules and assign values to all of graph’s nodes, returns graph with assigned colors, if successful, or null, if it fails.
The main algorithm is called RecursiveSolve2:
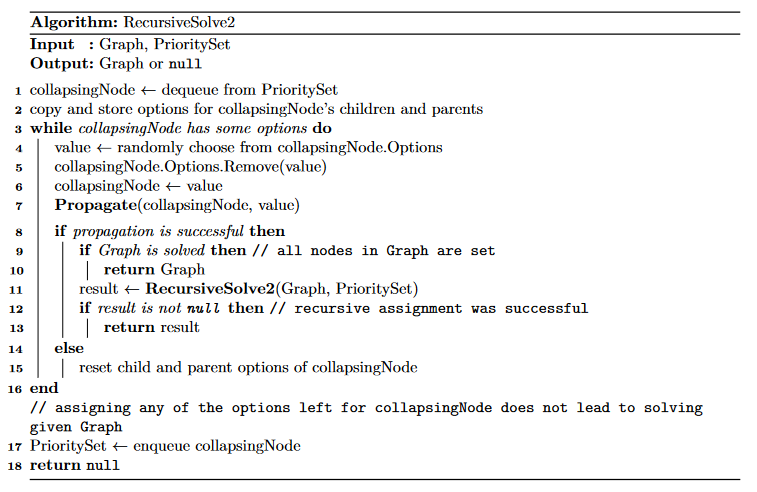
Nodes are collapsed in order by their Entropy, by default it’s Shannon Entropy, but user may specify any delegate when initializing the Solver, which is then used instead of the default one.
Constraints
Imagine you are given a Sudoku problem, you don’t start with an empty grid, rather with some of the values filled in - let’s call them constraints aka “the cells set before any solving takes place”.
These constraints can be passed to the Solver that takes them into count.
Example usage
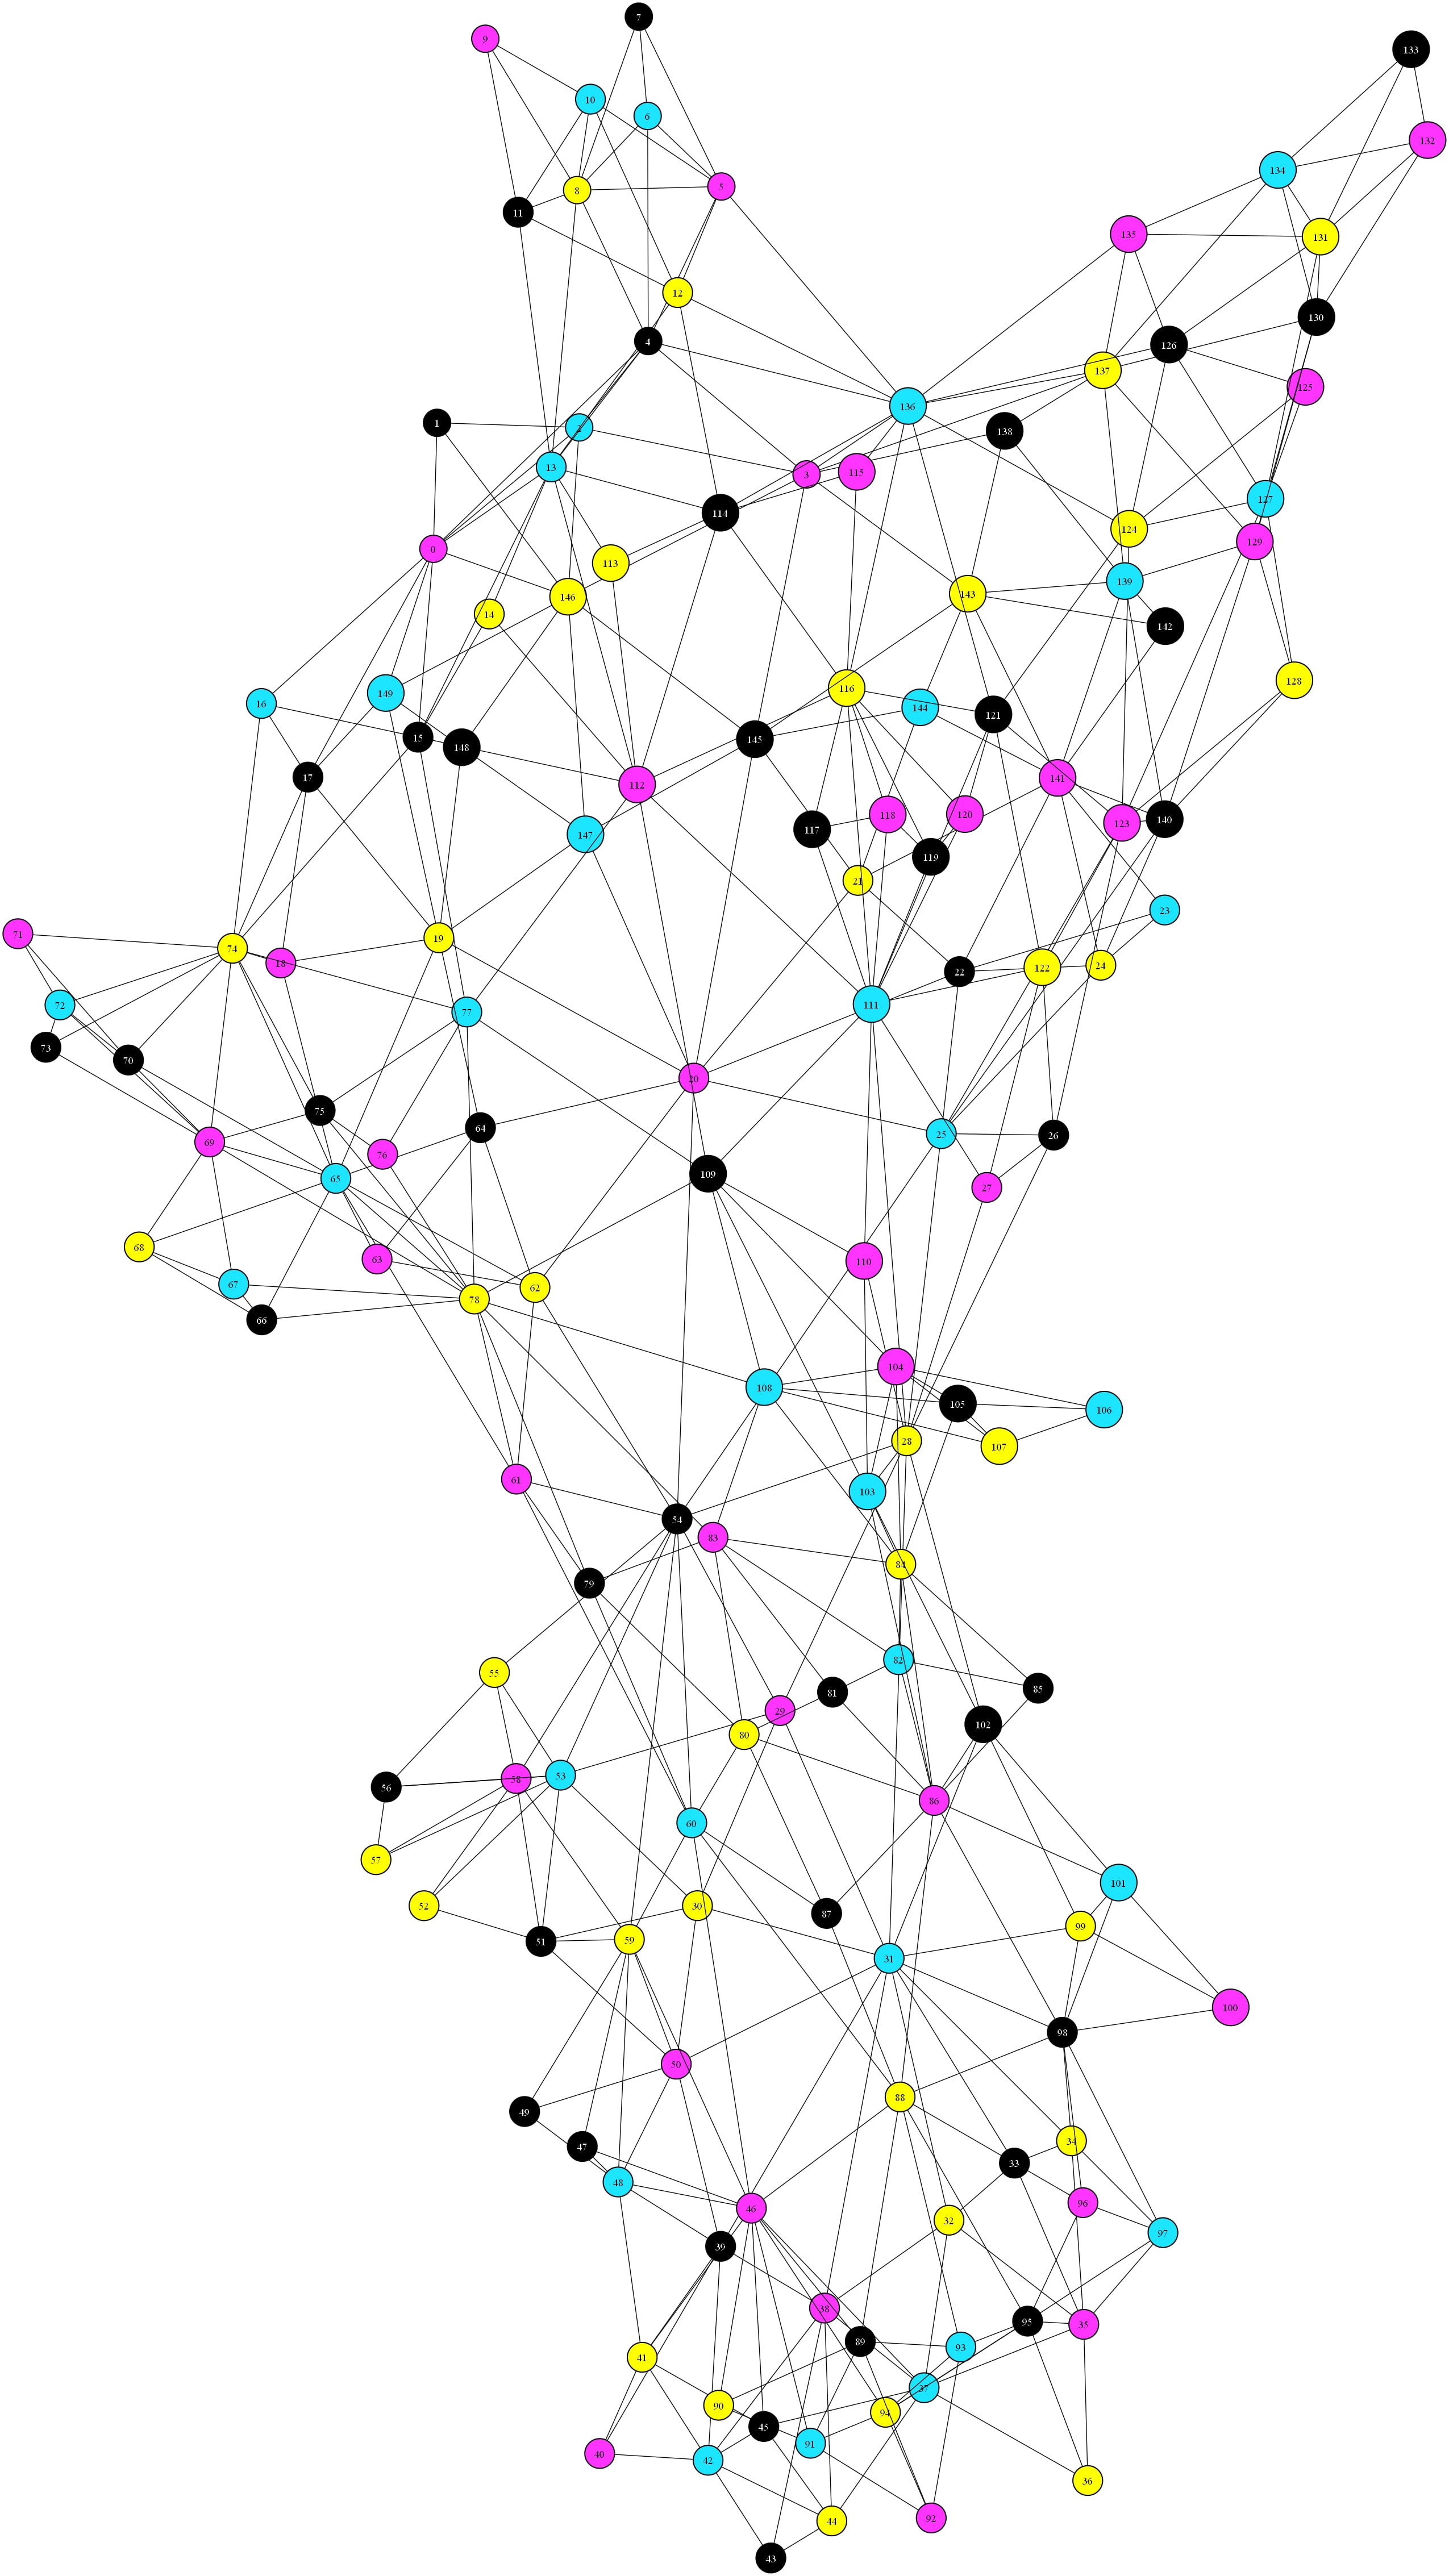
Graph Coloring
The base Solver is used to get the coloring and then methods CreateImage and ShowImage are used to render and show the result.
Grid Generation
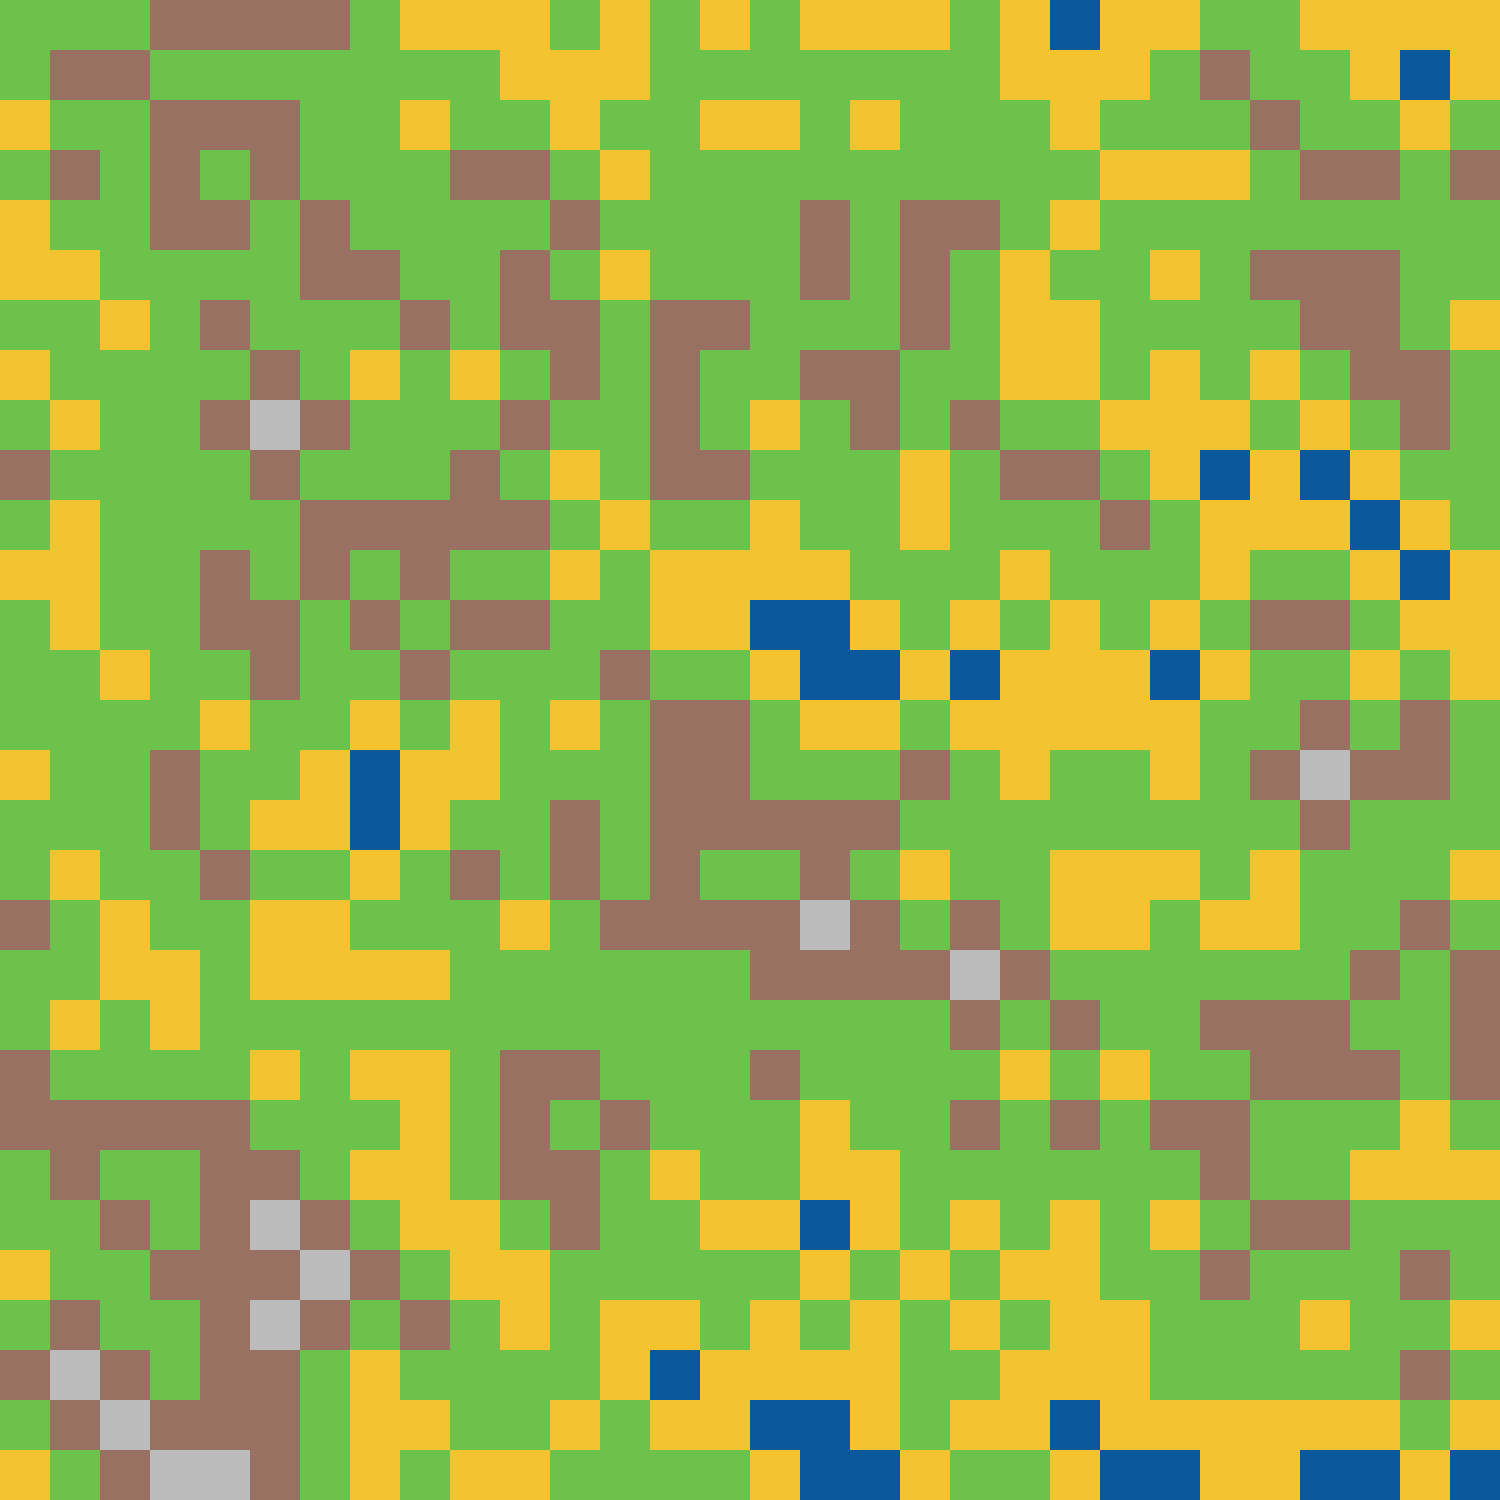
The wrapper for grids generates all the necessary edges which are then used to construct an undirected graph and passed to the Solver. We can define a “country gradient”: water, sand, grass, dirt and rocks; and end up with a really simle and stupid Minecraft-like terrain generator.
Sudoku
The wrapper generates all the necessary edges for all cells and also retrieves constraints from the problem given. This information is then used to create a graph that is passed to the base Solver with retrieved constraints.
0 0 0 5 0 9 0 0 4           8 7 3 5 2 9 1 6 4
0 2 0 0 6 0 5 0 9           1 2 4 7 6 3 5 8 9
0 0 9 1 4 8 0 3 0           5 6 9 1 4 8 2 3 7
0 0 0 4 0 0 0 0 0           2 1 6 4 5 7 3 9 8
4 0 0 0 9 0 0 0 0    ==>    4 3 5 8 9 1 7 2 6
0 0 0 0 0 0 0 1 5           7 9 8 2 3 6 4 1 5
0 8 0 0 0 0 9 5 0           3 8 1 6 7 4 9 5 2
0 4 2 0 0 0 8 0 0           6 4 2 9 1 5 8 7 3
0 0 0 0 0 0 6 4 1           9 5 7 3 8 2 6 4 1
Classes and methods to request new random boards from sugoku.onrender.com are provided.
Map Generation
Inspired by the game Peglin, I created a simple map generator and came up with some rules and frequencies. The map grows from one node into maximal width and then it collapses back into one node at the end.
There are four types of levels: normal fight (gray), treasure (red), boss fight (yellow), shop (blue); with frequencies [10, 5, 5, 5]. The player can only progress downwards, so the graph is oriented. Also we can pass a constraint to the Solver so that the player starts in a normal fight.
The output, player would progress from left to right:
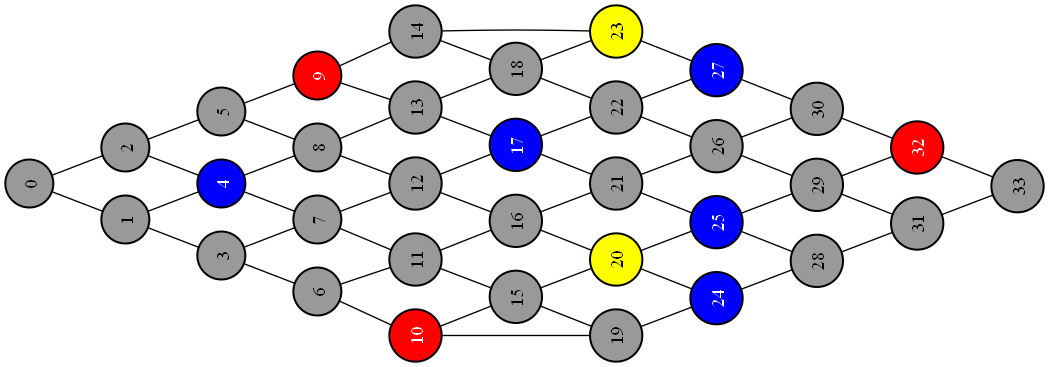
The rules; notice that after every boss fight (yellow) there’s a shop (blue):

Limitations
Stack overflow
By nature, this algorithm is recursive and requires a lot of memory and resources to remember graph’s state in case of backtracking. Unlike gridbased WFC, graphbased WFC may have more complex rules and structures to color and thus it needs to backtrack a lot more (sometimes gridbased WFC does not backtrack at all). So, yeah, stack overflow is a natural enemy of this kind of algorithm.
Personally, I have experienced crashes when working with around 2500 nodes - that’s a 50x50 grid (another example why using dedicated gridbased WFC is better). On the other hand, imagine a map with 2500 rooms/levels, that’s a big map. While playing a lot of roquelike game never have I encountered a map with more then hundred of rooms/levels.
Slow conversion from QuikGraph library
Even though conversion method QuikGraph -> GBWFC Graph is provided, I would not recommend using is, it is very generalized and therefore very slow. It is best to initialize the Graph from list of edges or to implement your own method for converting between the two libraries.
QuikGraph has a great documentation so figuring out the fastest conversion algorithm for each graph class should not be that difficult, but, unfortunately, this is outside the scope of this project.
